Exploratory Data Analysis

Also called EDA, this service is a complex set of procedures aimed at understanding data and relationship among variables. Armed with this information, you’ll have the ability to make more informed business decisions. Data Preparation and Feature Engineering are part of Exploratory Data Analysis. The following reports are examples of EDA.

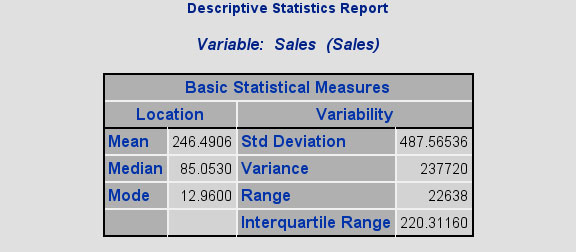
Descriptive Statistics

A Descriptive Statistics report will summarize your data and give you an overview of your information. In today’s data-rich digital marketplace, this service can play an important role in helping you understand a lot of information quickly and easily.

click to view larger

Confidence Intervals for Descriptive Statistics

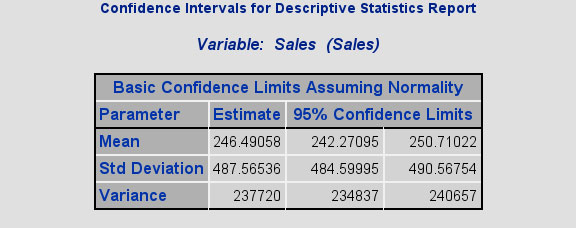
This service computes the confidence intervals for Descriptive Statistics with ninety-five percent confidence. In this example, the ninety-five percent confidence interval for average sales is ($242.27, $250.71).

click to view larger

Correlation Coefficient

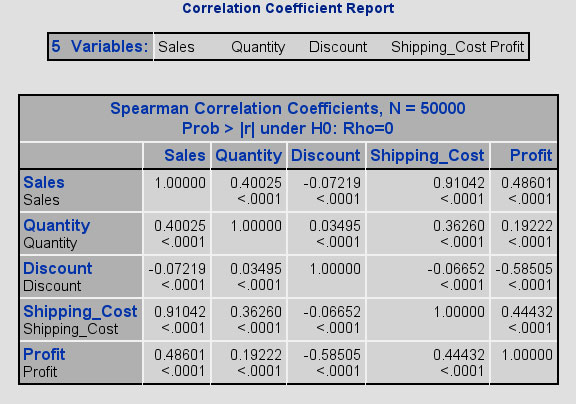
Correlation Coefficient measures the strength of the linear association between two numerical variables.
It’s always between -1 and +1, and each extreme indicates a perfect linear association. It’s also sensitive to outliers; a single outlying value can make a small correlation large or make a large one small.

click to view larger

Dimension Reduction

Dimension Reduction is the process of selecting a subset of your data for use in discriminating among the classes. This service removes all variables expected to have small or no contribution to predictive models.

click to view larger

Distribution of Categorical Data

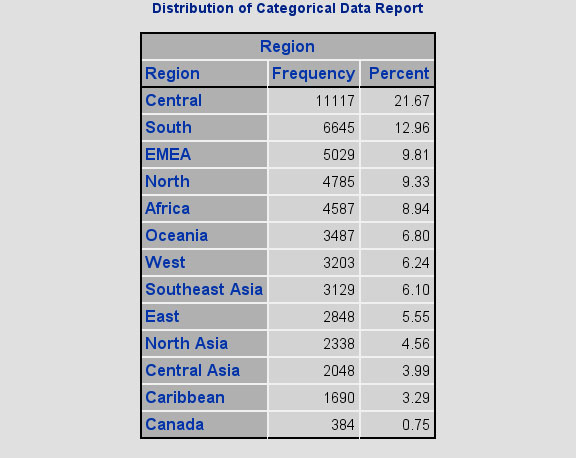
This report creates a frequency table that lists the categories and gives the counts and percentages of observations in each category. The distribution of each variable reveals any interesting characteristics or potential problems.

click to view larger

Distribution of Numerical Data

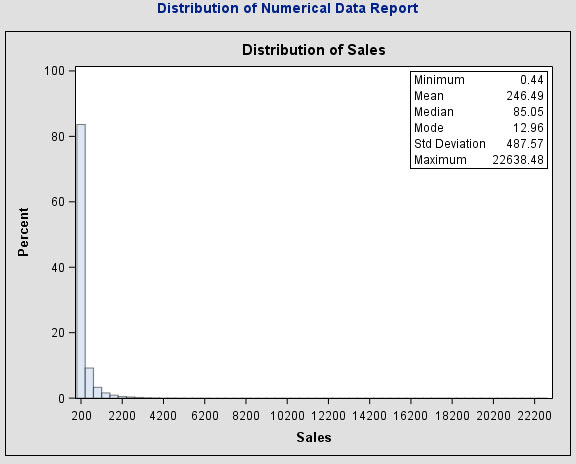
This report creates bar graphs that apply to numerical data for displaying the number of observations in each class as the height of each bar. The distribution of each variable usually reveals any interesting characteristics or potential problems.

click to view larger

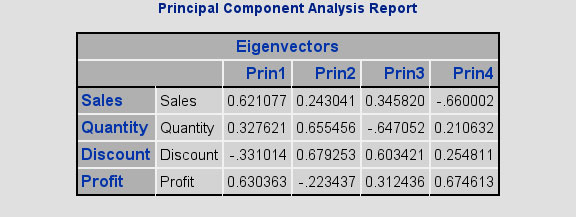
Principal Component Analysis

Principal Component Analysis ( PCA ) is a multivariate technique for examining relationships among numeric variables. The basic idea is to find a set of linear transformations of the original variables, such that the new set of variables could describe most of the variance in a relatively fewer number of variables.

click to view larger